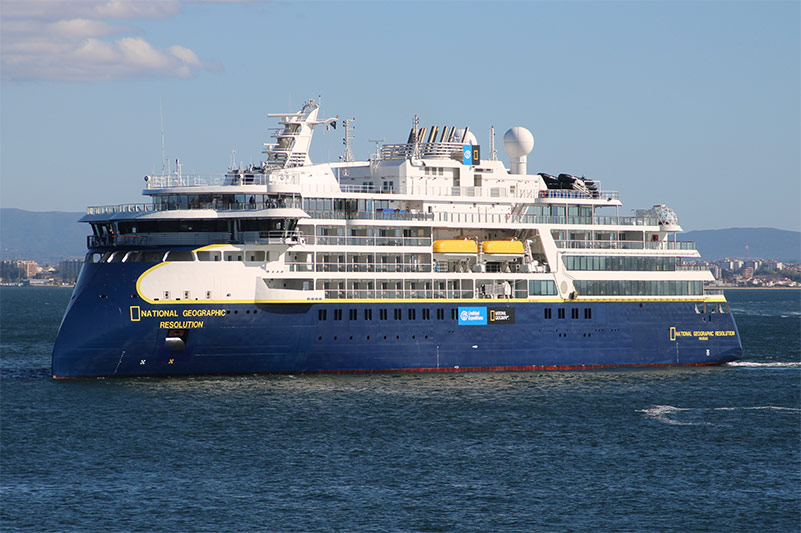
Lindblad Expeditions Holdings today reported financial results for the first quarter ended March 31, 2023.
Key Highlights:
- Total revenue of $143.4 million increased $75.5 million versus 2022 and $53.7 million compared with 2019;
- Net loss available to stockholders of $0.4 million improved $42.6 million versus 2022;
- Adjusted EBITDA of $27.2 million increased $48.4 million versus 2022 and $5.1 million compared with 2019;
- Lindblad segment Net Yield per Available Guest Night of $1,205 increased 63% versus 2022 and 10% compared with 2019;
- Occupancy of 81% compared with 66% in 2022;
- Strong reservations for future travel with bookings for 2023 45% ahead of bookings for 2019 at the same point in 2019;
- Following the quarter, further increased financial flexibility through issuance of new senior secured notes;
Dolf Berle, Chief Executive Officer, said: “Lindblad is off to a great start in 2023 as the momentum we have generated since emerging from the pandemic continued in earnest during the first quarter. The strategic investments we have made to expand capacity and diversify our product portfolio are delivering strong results as new and returning guests are eager to explore the world’s most amazing destinations. We are also just beginning to tap into the expanded earnings potential of the Company. Demand for expedition travel continues to grow and as we further ramp occupancies, continue to broaden and deepen our offering of high-quality authentic experiences and maintain premium pricing levels, we are uniquely positioned to significantly ramp earnings and build long-term shareholder value in the years ahead.”
FIRST QUARTER RESULTS
Tour Revenues
First quarter tour revenues of $143.4 million increased $75.5 million, or 111%, as compared to the same period in 2022. The increase was driven by a $65.2 million increase at the Lindblad segment and a $10.3 million increase at the Land Experiences segment.
Lindblad segment tour revenue of $115.5 million increased $65.2 million, or 130%, compared to the first quarter a year ago primarily due to a 71% increase in available guest nights as we continued to ramp operations. The year-on-year growth was also driven by a 63% increase in net yield per available guest night to $1,205 due to increased pricing and broader fleet utilization, as well as from an increase in occupancy to 81% from 66% in the first quarter a year ago.
Land Experiences tour revenues of $27.9 million increased $10.3 million, or 59%, compared to the first quarter a year ago primarily due to the ramp in departures and higher pricing.
Net Income
Net loss available to stockholders for the first quarter was $0.4 million, $0.01 per diluted share, as compared with net loss available to stockholders of $43.0 million, $0.85 per diluted share, in the first quarter of 2022. The $42.6 million improvement primarily reflects the ramp in operations, which was partially offset by $1.5 million of income tax expense versus a $0.1 million tax benefit, in the first quarter a year ago due to the improved operating results and a $1.8 million increase in interest expense due to additional borrowings and higher rates.
Adjusted EBITDA
First quarter Adjusted EBITDA of $27.2 million increased $48.4 million as compared to the same period in 2022 driven by a $47.1 million increase at the Lindblad segment and a $1.3 million increase at the Land Experiences segment.
Lindblad segment Adjusted EBITDA of $26.1 million increased $47.1 million as compared to the same period in 2022, primarily due to increased tour revenues, partially offset by higher cost of tours and increased personnel costs related to the ramp in operations, increased commissions related to the revenue and bookings growth and higher marketing costs to drive future growth.
Land Experiences segment Adjusted EBITDA of $1.1 million increased $1.3 million as compared to the same period in 2022, primarily due to increased tour revenues, partially offset by higher cost of tours and increased personnel costs related to the ramp in operations, increased commissions related to the revenue and bookings growth and higher marketing costs to drive future growth.


