Northern Europe will once again be the fourth largest cruise market, with traffic up a moderate 4.4 percent year-over-year, according to the 2019 Cruise Industry News Annual Report.
Traffic is concentrated to the Baltic, Norwegian fjords and British Isles, while new deployments in Iceland and Greenland continue to pop up.
The Baltic and Norwegian fjords are known to be a high-cost operating area, with strict environmental costs and high port fees, while the flip-side is the summer season is among the highest yielding as the region garners a high ticket price and strong shore excursion sales.
Northern Europe’s market capacity accounts for 9.4 percent of the global cruise industry, according to the 2019 Cruise Industry News Annual Report.
Among coming challenges will be port congestion, with limited berth space available as the cruise industry continues to grow aggressively. In addition, some Norwegian ports are looking to limit cruise traffic while the World Heritage fjords aim to eliminate all ship air emissions by 2026.
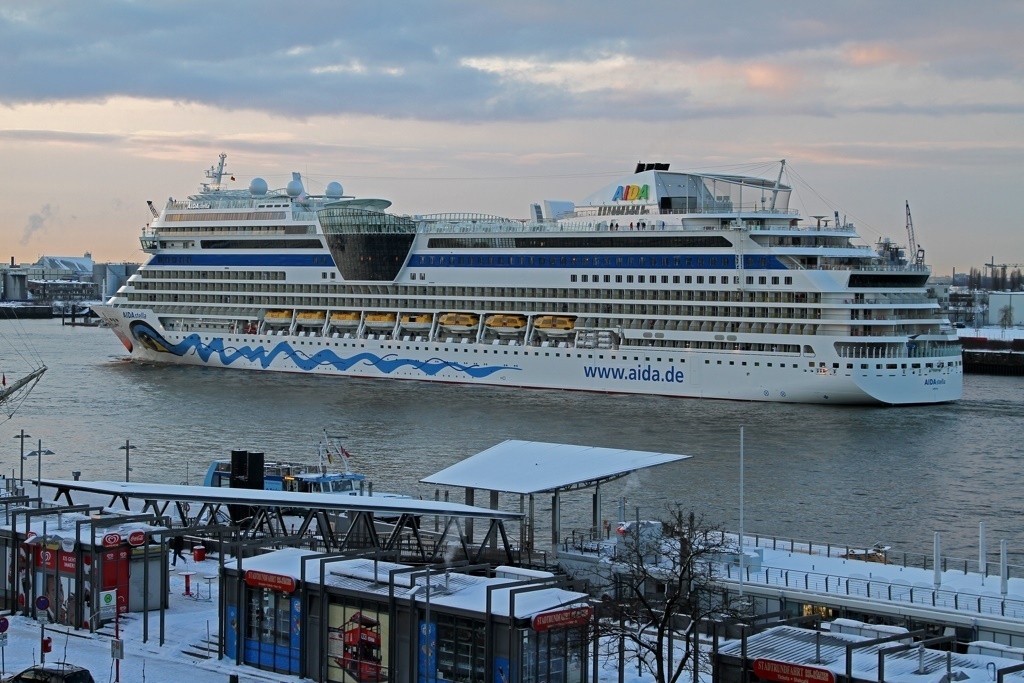
Germany’s AIDA Cruises is the largest operator in Northern Europe, accounting for 16.6 percent of the market and enjoying a heavy presence out of German homeports.
Other companies with large deployments in Northern Europe include Hurtigruten, with both its Norwegian coastal program and strong expedition footprint. MSC Cruises has also built capacity up in recent years, going from an estimated 137,000 guests in 2016 to more than 260,000 this year.
The biggest American brand in Northern Europe is Princess Cruises, which will have four ships in the region this summer, while Norwegian Cruise Line will have three.
Key homeports include Hamburg, Kiel and Bremerhaven in Germany. In the UK, Southampton leads the way while regional UK ports serve smaller operators and drive-to markets.
About the Annual Report:
The Cruise Industry News Annual Report is the only book of its kind, presenting the worldwide cruise industry through 2027 in 400 pages.
Statistics are independently researched.
See a preview by clicking here.
The report covers everything from new ships on order to supply-and-demand scenarios from 1987 through 2027+. Plus there is a future outlook, complete growth projections for each cruise line, regional market reports, and detailed ship deployment by region and market, covering all the cruise lines.


