Lindblad Expeditions Holdings has today reported financial results for the fourth quarter and full year ended December 31, 2023.
Sven Lindblad, Chief Executive Officer, said: “The record full year results we delivered in 2023 provides a glimpse of the earnings power of the Company as we further ramp our expedition operations and maximize the potential across our platform of leading land-based travel companies. The strategic investments we have already made to expand our ship capacity and diversify our land-based product offerings provides us significant opportunity in both the short and long-term given the growing market demand for authentic and immersive experiential travel.
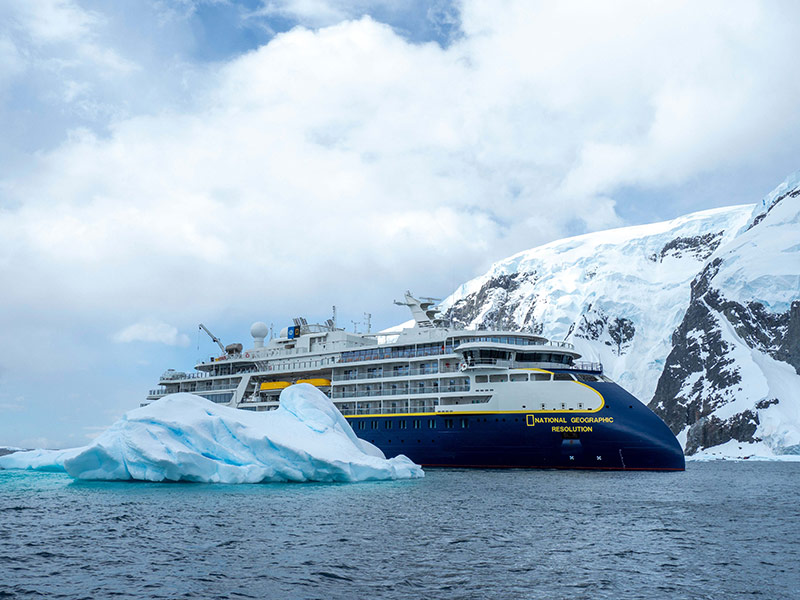
“This past quarter we took another important step to solidify and accelerate that opportunity by extending, and most importantly, expanding our strategic relationship with National Geographic. Over the past two decades, our intuitive connection and shared ethos has positively impacted hundreds of thousands of guests, while also providing meaningful support to some of the world’s most remarkable destinations. The expanded agreement will enable us to build on that success in the years ahead as we expand our addressable audiences, develop additional innovative expeditions and reach more citizen explorers than ever before.”
FULL YEAR RESULTS
Tour Revenues
Full year tour revenues of $569.5 million increased $148.0 million, or 35%, as compared to 2022. The increase was driven by a $119.0 million increase at the Lindblad segment and a $29.1 million increase at the Land Experiences segment.
Lindblad segment tour revenues of $397.4 million increased $119.0 million, or 43%, as compared to 2022 primarily due to a 33% increase in available guest nights as we continued to ramp operations. The year-on-year growth was also driven by a 12% increase in net yield per available guest night to $1,097 driven by increased pricing and higher occupancy of 77% in 2023 as compared to 75% a year ago.
Land Experiences tour revenues of $172.1 million increased $29.1 million, or 20%, compared to 2022 primarily due to additional departures and higher pricing.
Net Income
Net loss available to stockholders for the full year was $50.0 million, $0.94 per diluted share, as compared with net loss available to stockholders of $116.1 million, $2.23 per diluted share, in 2022. The $66.1 million improvement primarily reflects the ramp in operations, partially offset by a $7.5 million increase in interest expense due to additional borrowings and higher rates, a $6.7 million increase in stock-based compensation and a $3.8 million increase in other expense primarily from the write-off of $3.9 million in deferred financing fees due to refinancing the Company’s export credit facilities.
Adjusted EBITDA
Full year Adjusted EBITDA of $71.2 million increased $82.7 million as compared to 2022 driven by a $77.6 million increase at the Lindblad segment and a $5.1 million increase at the Land Experiences segment.
Lindblad segment Adjusted EBITDA of $48.5 million increased $77.6 million as compared to 2022, primarily due to increased tour revenues, partially offset by higher cost of tours and personnel costs related to the ramp in operations, increased commissions related to the revenue and bookings growth and higher marketing spend to drive future bookings.
Land Experiences segment Adjusted EBITDA of $22.8 million increased $5.1 million, or 29%, as compared to 2022, as increased tour revenues were mostly offset by higher cost of tours and increased personnel costs related to the ramp in operations and higher marketing costs to drive future bookings.
FOURTH QUARTER RESULTS
Tour Revenues
Fourth quarter tour revenues of $125.4 million increased $7.4 million, or 6%, as compared to the same period in 2022. The increase was driven by a $5.4 million increase at the Lindblad segment and a $2.0 million increase at the Land Experiences segment.
Lindblad segment tour revenues of $85.8 million increased $5.4 million, or 7%, as compared to the fourth quarter a year ago primarily due to an 18% increase in available guest nights as we continued to ramp operations. The year-on-year growth was partially offset by an 8% decline in net yield per available guest night to $1,021 primarily due to the impact of transit voyages in the current year which resulted in decreased pricing and lower occupancy of 70% as compared to 76% in the fourth quarter a year ago.
Land Experiences tour revenues of $39.6 million increased $2.0 million, or 5%, compared to the fourth quarter a year ago primarily due to additional departures and higher pricing.
Net Income
Net loss available to stockholders for the fourth quarter was $28.5 million, $0.53 per diluted share, as compared with net loss available to stockholders of $33.2 million, $0.63 per diluted share, in the fourth quarter of 2022. The $4.7 million improvement primarily reflects the ramp in operations, partially offset by a $4.0 million decline in tax benefit due to the improved operating results, a $2.9 million increase in stock-based compensation and $2.2 million of higher depreciation and amortization.
Adjusted EBITDA
Fourth quarter Adjusted EBITDA of $3.8 million increased $6.6 million as compared to the same period in 2022 driven by a $5.2 million improvement at the Lindblad segment and a $1.4 million increase at the Land Experiences segment.
Lindblad segment Adjusted EBITDA loss of $0.4 million improved $5.2 million as compared to the same period in 2022, primarily due to increased tour revenues and lower fuel and drydock costs, partially offset by higher costs associated with operating additional trips and increased commissions related to the revenue and bookings growth.
Land Experiences segment Adjusted EBITDA of $4.3 million increased $1.4 million, or 48%, as compared to the same period in 2022, as increased tour revenues and lower selling and marketing expenses were partially offset by higher cost of tours and increased personnel costs related to the ramp in operations.
Full Year 2023 Highlights:
- Total revenues increased 35% to $569.5 million
- Net loss available to stockholders improved $66.1 million
- Adjusted EBITDA increased $82.7 million to $71.2 million
- Lindblad segment available guest nights increased 33%
- Net yield per available guest night increased 12% to $1,097 and occupancy increased to 77%
- Further increased financial flexibility with refinancing of export credit agreements through issuance of new senior secured notes
- Extended and expanded strategic relationship with National Geographic for an additional 17 years through 2040