Lindblad Expeditions today reported financial results for the fourth quarter and full year ended December 31, 2022.
Dolf Berle, Chief Executive Officer, said “Throughout 2022, Lindblad generated strong revenue growth as we successfully ramped our operations, returning to geographies we have been exploring for decades. We also expanded our product offerings, with broader utilization of our two new polar ships and further integration of our three acquired land-based travel companies. More travelers than ever before are looking for authentic and immersive experiences in unique destinations and with a proven track record of delivering high-quality expeditions in the world’s most remarkable geographies, Lindblad is distinctly positioned to capitalize on this growing demand. In 2023, we expect to further harness the expanded earnings power of the Company and deliver strong growth from pre-pandemic levels, while continuing to build long-term shareholder value.”
FULL YEAR RESULTS
Tour Revenues
Full year tour revenues of $421.5 million increased $274.4 million as compared to the same period in 2021. The increase was driven by a $195.6 million increase at the Lindblad segment and a $78.8 million increase at the Land Experiences segment, primarily due to the ramp in expeditions and trips and higher pricing. The Land Experiences segment also includes a full year of results for Off the Beaten Path LLC (“Off the Beaten Path”), DuVine Cycling + Adventure (“DuVine”) and Classic Journeys, LLC (“Classic Journeys”), which were acquired during 2021.
Net Income
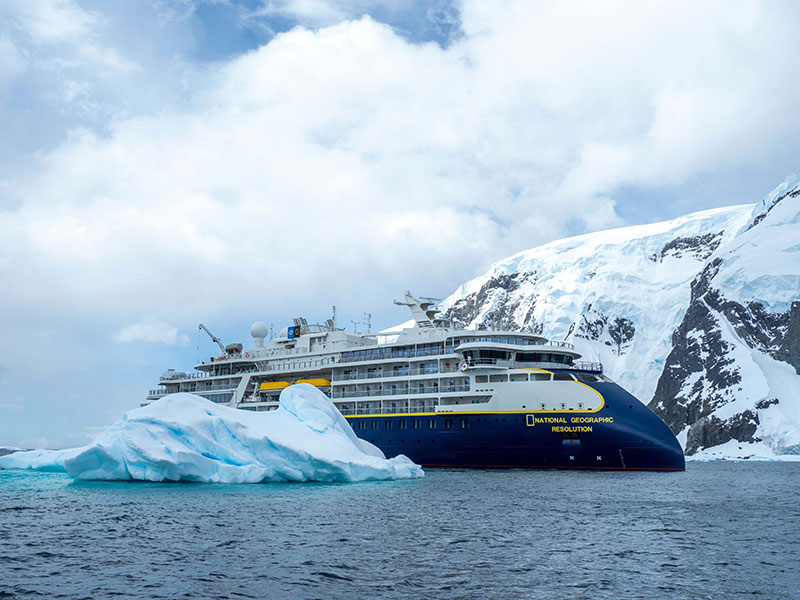
Net loss available to stockholders for the full year was $116.1 million, $2.23 per diluted share, as compared with net loss available to stockholders of $124.7 million, $2.41 per diluted share, in 2021. The $8.6 million improvement primarily reflects the ramp in operations, partially offset by a $12.9 million increase in interest expense due to additional borrowings and higher rates, a $8.1 million increase in tax expense and a $4.5 million increase in depreciation and amortization, primarily due to the addition of the National Geographic Resolution to the fleet in September 2021. Additionally, other income declined by $15.8 million primarily due to $10.9 million of costs related to refinancing the Company’s term loan and revolving credit facilities and a $3.8 million decrease in 2022 versus 2021 for income recognized through utilization of the grant for the Coronavirus Economic Relief for Transportation Services (“CERTS”) Act for covered expenses.
Adjusted EBITDA
Full year Adjusted EBITDA loss of $11.5 million improved $52.5 million as compared to the same period in 2021 driven by a $38.1 million improvement at the Lindblad segment and a $14.4 million increase at the Land Experiences segment.
Lindblad segment Adjusted EBITDA loss of $29.2 million improved $38.1 million as compared to 2021, primarily from increased tour revenues, partially offset by higher cost of tours and increased personnel costs from the ramp in operations, higher commissions related to the revenue and bookings increase and higher marketing costs to drive future growth.
Land Experiences segment Adjusted EBITDA of $17.6 million increased $14.4 million as compared to 2021, primarily due to additional trips, partially offset by higher cost of tours and increased personnel costs from the ramp in operations and increased marketing costs to drive future bookings. The Land Experiences segment also includes a full year of results for Off the Beaten Path, DuVine and Classic Journeys, which were acquired during 2021.
FOURTH QUARTER RESULTS
Tour Revenues
Fourth quarter tour revenues of $118.0 million increased $52.4 million as compared to the same period in 2021. The increase was driven by a $37.8 million increase at the Lindblad segment and a $14.6 million increase at the Land Experiences segment, primarily due to the ramp in expeditions and trips compared with the fourth quarter a year ago and higher pricing. The Land Experiences segment also includes a full quarter of results for Classic Journeys, which was acquired during the fourth quarter of 2021.
Net Income
Net loss available to stockholders for the fourth quarter was $33.2 million, $0.63 per diluted share, as compared with net loss available to stockholders of $27.8 million, $0.54 per diluted share, in the fourth quarter of 2021. The $5.4 million decrease primarily reflects the ramp in operations, which was offset by a decline in other income of $11.5 million primarily due to the utilization in the fourth quarter of 2021 of the CERTS grant for covered expense. The fourth quarter of 2022 also included an increase in tax expense of $4.8 million and an increase in interest expense of $3.9 million due to additional borrowings and higher rates.
Adjusted EBITDA
Fourth quarter Adjusted EBITDA loss of $2.7 million improved $11.0 million as compared to the same period in 2021 driven by a $10.3 million improvement at the Lindblad segment and a $0.7 million increase at the Land Experiences segment.
Lindblad segment Adjusted EBITDA loss of $5.6 million improved $10.3 million as compared to the same period in 2021, primarily from increased tour revenues, partially offset by higher cost of tours and increased personnel costs from the ramp in operations, higher commissions related to the revenue and bookings increase and higher marketing costs to drive future growth.
Land Experiences segment Adjusted EBITDA of $2.9 million increased $0.7 million as compared to 2021, primarily due to additional trips, partially offset by higher cost of tours, increased personnel costs related to the ramp in operations and increased marketing costs to drive future bookings. The Land Experiences segment also includes a full quarter of results for Classic Journeys, which was acquired during the fourth quarter of 2021.