Skip to content
  • Home
  • Search
  • Expedition Report
  • River Report
  • Orderbook
  • Research
  • About Us
  • Email News
  • Advertise
  • Store
  • Contact
  • Home
  • Search
  • Expedition Report
  • River Report
  • Orderbook
  • Research
  • About Us
  • Email News
  • Advertise
  • Store
  • Contact
Twitter Facebook Linkedin
cin header 2025
Cruise Industry News Logo
  • Home
  • Cruise News
    • Cruise News Index
    • Email Alerts | E-Newsletter
    • Cruise Ship Orderbook
    • Ship Sales and Transfers
    • Search
    • Trade Shows and Events
    • PDF Resources
    • Historical Data
  • Quarterly Magazine
    • Quarterly Magazine
    • Feature Magazine Articles
    • Subscribe
  • 2026 Annual Report
    • 2026 Annual Report
    • River Report
    • Full Product Package
  • 2026 Executive Guide
    • 2026 Executive Guide
  • Digital Reports
    • Euro River Market Report
    • Global Cruise Ship Index
    • Expedition Market Report
    • Riverboat Index
    • Secondhand Market
    • Luxury Market Report
    • Drydocking and Refurb
    • Orderbook Capacity Data
    • China Market Report
    • Full Product Package
  • SUBSCRIBE
  • Home
  • Cruise News
    • Cruise News Index
    • Email Alerts | E-Newsletter
    • Cruise Ship Orderbook
    • Ship Sales and Transfers
    • Search
    • Trade Shows and Events
    • PDF Resources
    • Historical Data
  • Quarterly Magazine
    • Quarterly Magazine
    • Feature Magazine Articles
    • Subscribe
  • 2026 Annual Report
    • 2026 Annual Report
    • River Report
    • Full Product Package
  • 2026 Executive Guide
    • 2026 Executive Guide
  • Digital Reports
    • Euro River Market Report
    • Global Cruise Ship Index
    • Expedition Market Report
    • Riverboat Index
    • Secondhand Market
    • Luxury Market Report
    • Drydocking and Refurb
    • Orderbook Capacity Data
    • China Market Report
    • Full Product Package
  • SUBSCRIBE

Cruise Lines 2019 Q1 Breakdown: By the Numbers

  • May 13, 2019

Cruise Industry News takes a look at the financial performance of the “big three” following the first quarter of 2019.

Takeaways:

Total revenue for all three companies grew, but so did operating expenses. Net income per passenger day was down at Carnival Corporation, and up slightly at both Royal Caribbean Cruises and Norwegian Cruise Line Holdings.

Arnold Donald, president and CEO of Carnival Corporation, said on the company’s earnings call that bookings were strong in Europe and for the company’s European brands on Carnival’s first quarter earnings call despite economic malaise in Continental Europe. The company’s cumulative advanced bookings for its Europe and Asia brands were said to be well ahead of the prior year but at lower prices driven by Europe and Asia brand sourcing in Continental Europe and Asia.

For Royal Caribbean, the company saw a noticeable spike in onboard revenue growth. Onboard revenue for Royal Caribbean Cruises was up significantly in the company’s first quarter, going from $602 million in 2018 to $729 million in 2019. Jason T. Liberty, CFO, attributed the growth toward a shift toward experiences over buying goods. Passengers spent an average of $69.10 (gross) per day in the first quarter compared to $62.55 a year prior.

Norwegian Cruise Line Holdings entered the year at a record booked position at higher pricing, giving the company the position to focus on driving price, said President and CEO Frank Del Rio.  Net ticket revenue per passenger day was up, reported at $149.54 versus $142.13 the previous year.

Fuel costs were up at Carnival and Norwegian, and flat at Royal Caribbean. Questions still loom over 2020 as cruise lines will have essentially two options to meet the IMO rules: burn expensive marine gas oil (MGO) which may see pricing pressure, or use traditional heavy fuel oil (HFO) and clean the exhaust coming out of the stack with a scrubber.

pdf iconDownload a PDF of this information here.
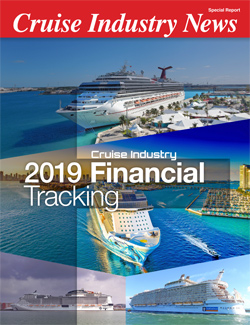

2019 financeCruise Industry Financial Tracking

The Cruise Industry Financial Tracking Report provides an in-depth look into the financial metrics of the leading cruise companies. Learn more.

Included: Carnival, Royal Caribbean, Norwegian, MSC, Star/Genting, Royal Olympic, P&O Princess, Regent, American Classical Voyages and Commodore.

Key metrics include revenue, operating expenses, operating income and net income, as well as those metrics on a per passenger day basis. We also look at EPS, fleets, berths and passenger cruise days. 


Past Data:

2018 Cruise Lines Q4 By the Numbers

2018 Cruise Lines Q3 By the Numbers

2018 Cruise Lines Q2 By the Numbers

2018 Cruise Lines Q1 By the Numbers

2017 Cruise Lines Q4 By the Numbers

2017 Cruise Lines Q3 By the Numbers

2017 Cruise Lines Q2 By the Numbers

2017 Cruise Lines Q1 By the Numbers

2016 Cruise Lines Q4 By the Numbers

2016 Cruise Lines Q3 By the Numbers

2016 Cruise Lines Q2 By the Numbers

2016 Cruise Lines Q1 By the Numbers
 

Cruise Industry News Email Alerts


  • Cruise News
  • Magazine Subscription
  • Email Newsletter
  • Search
  • Cruise News
  • Magazine Subscription
  • Email Newsletter
  • Search
  1. Cruise Industry News
  2. Cruise News
  3. Cruise Lines 2019 Q1 Breakdown: By the Numbers
EMAIL NEWSLETTER

Get the latest breaking cruise news. Sign up.

CRUISE SHIP ORDERBOOK

84 Ships | 229,384 Berths | $89 Billion | View

Drydock Report
2026 Drydock Report

Highlights:

  • Full Overview
  • Record Refit Year
  • 26-27-28 Schedule
  • PDF Download
  • Order Today
2026 Executive Guide

Highlights:

  • All Brands
  • Decision Makers
  • Contact Info
  • Brand Background 
  • Instant Download
  • Order Today
Cruise Industry News
  • Advertising
  • About
  • Contact
Online News
  • Cruise News
  • Feature Magazine Articles
  • Orderbook
  • Events
Publications
  • Quarterly Magazine
  • Annual Report
  • Email Newsletter
  • Executive Guide
  • Digital Reports
Connect
  • Search
  • Facebook
  • Twitter
  • LinkedIn
© Cruise Industry News 1996-2026. All Rights Reserved.