


Page 22 - 2026 CIN Annual Report
P. 22
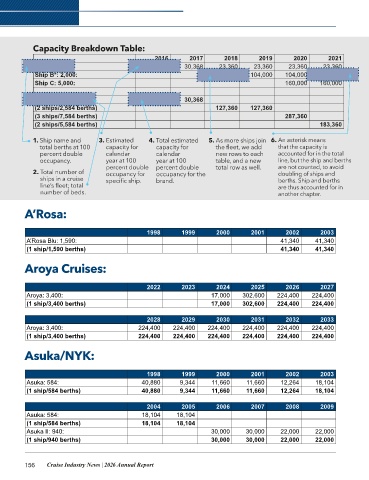
Capacity Breakdown Table:
                                                    2016       2017       2018        2019       2020       2021
            Ship A: 584:                          30,368     30,368      23,360     23,360     23,360      23,360
            Ship B*: 2,000:                                             104,000    104,000    104,000    104,000*
            Ship C: 5,000:                                                                    160,000     160,000


            (1 ship/584 berths)                   30,368     30,368
            (2 ships/2,584 berths)                                      127,360    127,360
            (3 ships/7,584 berths)                                                            287,360
            (2 ships/5,584 berths)                                                                        183,360


            1.  Ship name and    3.  Estimated    4.  Total estimated   5.  As more ships join  6.  An asterisk means
              total berths at 100   capacity for    capacity for        the fleet, we add   that the capacity is
              percent double        calendar        calendar            new rows to each    accounted for in the total
              occupancy.            year at 100     year at 100         table, and a new    line, but the ship and berths
                                    percent double   percent double     total row as well.   are not counted, to avoid
            2.  Total number of     occupancy for   occupancy for the                       doubling of ships and
              ships in a cruise     specific ship.  brand.                                  berths. Ship and berths
              line’s fleet; total                                                           are thus accounted for in
              number of beds.                                                               another chapter.


         A’Rosa:


                                                 1998       1999        2000       2001       2002        2003
          A’Rosa Blu: 1,590:                                                                 41,340     41,340
          (1 ship/1,590 berths)                                                              41,340     41,340


         Aroya Cruises:


                                                 2022       2023        2024       2025       2026        2027
          Aroya: 3,400:                                               17,000     302,600    224,400    224,400
          (1 ship/3,400 berths)                                       17,000    302,600     224,400    224,400

                                                 2028       2029        2030       2031       2032        2033
          Aroya: 3,400:                        224,400    224,400    224,400     224,400    224,400    224,400
          (1 ship/3,400 berths)               224,400     224,400    224,400    224,400     224,400    224,400


         Asuka/NYK:


                                                 1998       1999        2000       2001       2002        2003
          Asuka: 584:                           40,880      9,344      11,660     11,660     12,264     18,104
          (1 ship/584 berths)                  40,880       9,344     11,660     11,660      12,264     18,104

                                                 2004       2005        2006       2007       2008        2009
          Asuka: 584:                           18,104     18,104
          (1 ship/584 berths)                  18,104      18,104
          Asuka II: 940:                                              30,000      30,000     22,000     22,000
          (1 ship/940 berths)                                         30,000     30,000      22,000     22,000


         156    Cruise Industry News | 2026 Annual Report

