
Page 33 - CIN - Annual Report
P. 33
[ Market Reports ]
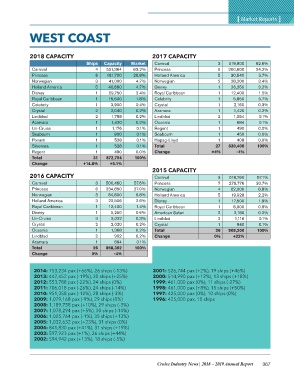
WEST COAST
2018 CAPACITY Ships Capacity Market 2017 CAPACITY 3 519,900 62.6%
4 551,364 63.2% 6 200,600 24.2%
6 181,700 20.8% Carnival 5
Carnival 3 41,000 Princess 2 30,540 3.7%
Princess 5 40,660 4.7% Holland America 1 28,200 3.4%
Norwegian 1 29,750 4.7% Norwegian 1 26,250 3.2%
Holland America 1 15,500 3.4% Disney 1 12,400 1.5%
Disney 1 3,900 1.8% Royal Caribbean 1 0.7%
Royal Caribbean 2 2,040 0.4% Celebrity 1 5,850 0.3%
Celebrity 2 1,798 0.2% Crystal 2 2,160 0.2%
Crystal 1 1,420 0.2% Azamara 1 1,420 0.1%
Lindblad 1 1,176 0.2% Lindblad 1 1,054 0.1%
Azamara 1 900 0.1% Oceania 1 0.0%
Un-Cruise 1 528 0.1% Regent 1 684 0.0%
Seabourn 1 528 0.1% Seabourn 27 490 0.0%
Ponant 1 490 0.1% Hapag-Lloyd +4% 450 100%
Silversea 872,754 0.0% Total 408
Regent 31 +5.1% 100% Change 830,406
Total +14.8% -4%
Change 2015 CAPACITY
3 500,460 3 518,760 57.1%
2016 CAPACITY 6 234,850 57.6% Carnival 7 278,776 30.7%
3 84,800 27.0% Princess 4 62,000
Carnival 3 22,506 9.8% Norwegian 5 19,928 6.8%
Princess 1 12,400 2.6% Holland America 1 17,500 2.2%
Norwegian 1 5,250 Disney 1 8,000 1.9%
Holland America 3 3,022 1.4% Royal Caribbean 2 2,180 0.9%
Royal Caribbean 2 2,020 0.6% American Safari 2 1,116 0.2%
Disney 1 1,368 0.3% Lindblad 1 940 0.1%
Un-Cruise 2 992 0.2% Crystal 26 909,200 0.1%
Crystal 1 694 0.2% Total 0% +22% 100%
Oceania 26 868,362 0.2% Change
Lindblad 0% -4% 0.1%
Azamara 100%
Total
Change
2014: 753,234 pax (+66%), 26 ships (-13%) 2001: 526,744 pax (+2%), 19 ships (+46%)
2013: 447,452 pax (-19%), 30 ships (+25%) 2000: 514,990 pax (+12%), 13 ships (+18%)
2012: 553,788 pax (-22%), 24 ships (0%) 1999: 461,000 pax (0%), 11 ships (-27%)
2011: 706,018 pax (-26%), 24 ships (-14%) 1998: 461,000 pax (+8%), 15 ships (+50%)
2010: 951,358 pax (-12%), 28 ships (-3%) 1997: 425,000 pax (0%), 10 ships (0%)
2009: 1,079,168 pax (-9%), 29 ships (0%) 1996: 425,000 pax, 10 ships
2008: 1,189,758 pax (+10%), 29 ships (-3%)
2007: 1,078,294 pax (+5%), 30 ships (-14%)
2006: 1,025,764 pax (-1%), 35 ships (+13%)
2005: 1,032,632 pax (+23%), 31 ships (0%)
2004: 841,830 pax (+41%), 31 ships (+19%)
2003: 597,923 pax (+1%), 26 ships (+44%)
2002: 594,942 pax (+13%), 18 ships (-5%)
Cruise Industry News | 2018 – 2019 Annual Report 367