
Page 31 - CIN - Annual Report
P. 31
[ Market Reports ]
ALASKA
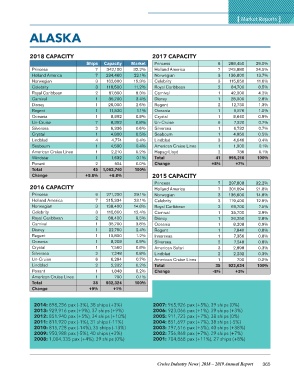
2018 CAPACITY Ships Capacity Market 2017 CAPACITY 6 288,450 29.0%
7 342,100 32.2% 7 243,880 24.5%
7 234,460 22.1% Princess 3 136,800 13.7%
Princess 3 162,600 15.3% Holland America 3 115,650 11.6%
Holland America 3 118,500 11.2% Norwegian 2
Norwegian 2 87,800 Celebrity 1 84,700 8.5%
Celebrity 1 35,700 8.3% Royal Caribbean 1 42,000 4.2%
Royal Caribbean 1 28,000 3.4% Carnival 2 28,000 2.8%
Carnival 1 11,520 2.6% Disney 1 12,730 1.3%
Disney 1 8,892 1.1% Regent 1 1.0%
Regent 7 8,392 0.8% Oceania 6 9,576 0.9%
Oceania 2 6,336 0.8% Crystal 1 8,640 0.7%
Un-Cruise 1 4,800 0.6% Un-Cruise 1 7,320 0.7%
Silversea 4 4,774 0.5% Silversea 3 6,732 0.5%
Crystal 1 4,500 0.4% Seabourn 1 4,950 0.4%
Lindblad 1 2,210 0.4% Lindblad 2 4,046 0.1%
Seabourn 1 1,632 0.2% American Cruise Lines 41 1,000 0.1%
American Cruise Lines 2 524 0.1% Hapag-Lloyd +8% 100%
Windstar 0.0% Total 736
Ponant 45 1,062,740 100% Change 995,210
Total +9.8% +6.8%
Change 2015 CAPACITY +7%
2016 CAPACITY 6 271,200 29.1% Princess 7 297,808 32.2%
7 215,334 23.1% Holland America 7 201,694 21.8%
Princess 3 138,400 14.8% Norwegian 3 136,600 14.8%
Holland America 3 115,650 12.4% Celebrity 3 119,400 12.9%
Norwegian 2 88,400 9.5% Royal Caribbean 2 69,700
Celebrity 1 3.8% Carnival 1 35,700 7.5%
Royal Caribbean 1 35,700 2.4% Disney 1 26,250 3.9%
Carnival 1 22,750 1.2% Oceania 1 8,208 2.8%
Disney 1 10,800 0.9% Regent 1 7,840 0.9%
Regent 1 8,208 0.8% Innerseas 1 7,356 0.8%
Oceania 2 0.8% Silversea 2 7,248 0.8%
Crystal 6 7,560 0.7% American Safari 3 2,898 0.8%
Silversea 2 7,248 0.2% Lindblad 2 2,232 0.3%
Un-Cruise 1 6,294 0.2% American Cruise Lines 1 700 0.3%
Lindblad 1 2,232 Total 35 923,634 0.2%
Ponant 38 1,848 0.1% Change -8% +3% 100%
American Cruise Lines +9% 100%
Total 700
Change 932,324
+1%
2014: 898,256 pax (-3%), 38 ships (+3%) 2007: 965,926 pax (+5%), 39 ships (0%)
2013: 929,916 pax (+9%), 37 ships (+9%) 2006: 923,066 pax (+1%), 39 ships (+3%)
2012: 851.940 pax (+5%), 34 ships (+10%) 2005: 911,723 pax (+7%), 38 ships (0%)
2011: 811,920 pax (-1%), 31 ships (-11%) 2004: 851,697 pax (+7%), 38 ships (-5%)
2010: 815,728 pax (-14%), 35 ships (-13%) 2003: 797,516 pax (+5%), 40 ships (+38%)
2009: 950,988 pax (-5%), 40 ships (+3%) 2002: 756,868 pax (+7%), 29 ships (+7%)
2008: 1,004,335 pax (+4%), 39 ships (0%) 2001: 704,868 pax (+11%), 27 ships (+8%)
Cruise Industry News | 2018 – 2019 Annual Report 365