
Page 18 - 2025 China Market Report
P. 18
CHINA
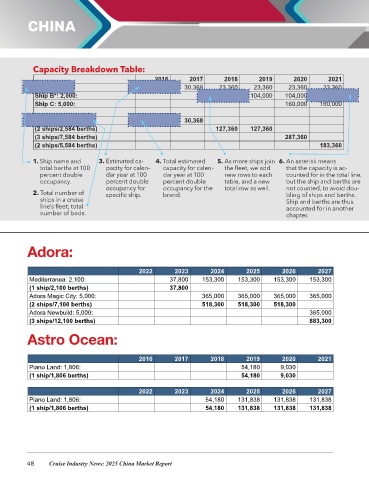
Capacity Breakdown Table:
2016 2017 2018 2019 2020 2021
Ship A: 584: 30,368 30,368 23,360 23,360 23,360 23,360
Ship B*: 2,000: 104,000 104,000 104,000 104,000*
Ship C: 5,000: 160,000 160,000
(1 ship/584 berths) 30,368 30,368
(2 ships/2,584 berths) 127,360 127,360
(3 ships/7,584 berths) 287,360
(2 ships/5,584 berths) 183,360
1. Ship name and 3. Estimated ca- 4. Total estimated 5. As more ships join 6. An asterisk means
total berths at 100 pacity for calen- capacity for calen- the fleet, we add that the capacity is ac-
percent double dar year at 100 dar year at 100 new rows to each counted for in the total line,
occupancy. percent double percent double table, and a new but the ship and berths are
occupancy for occupancy for the total row as well. not counted, to avoid dou-
2. Total number of specific ship. brand. bling of ships and berths.
ships in a cruise Ship and berths are thus
line’s fleet; total accounted for in another
number of beds. chapter.
Adora:
2022 2023 2024 2025 2026 2027
Mediterranea: 2,100: 37,800 153,300 153,300 153,300 153,300
(1 ship/2,100 berths) 37,800
Adora Magic City: 5,000: 365,000 365,000 365,000 365,000
(2 ships/7,100 berths) 518,300 518,300 518,300
Adora Newbuild: 5,000: 365,000
(3 ships/12,100 berths) 883,300
Astro Ocean:
2016 2017 2018 2019 2020 2021
Piano Land: 1,806: 54,180 9,030
(1 ship/1,806 berths) 54,180 9,030
2022 2023 2024 2025 2026 2027
Piano Land: 1,806: 54,180 131,838 131,838 131,838
(1 ship/1,806 berths) 54,180 131,838 131,838 131,838
48 Cruise Industry News: 2025 China Market Report