
Page 24 - CIN Annual 2020
P. 24
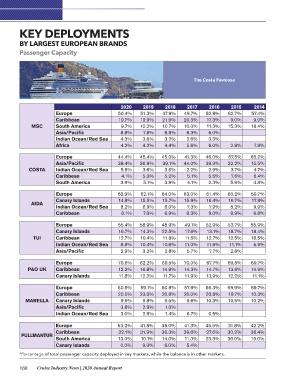
KEY DEPLOYMENTS

BY LARGEST EUROPEAN BRANDS
Passenger Capacity

                                                               The Costa Favolosa

MSC         Europe                 2020         2019    2018     2017    2016                             2015     2014
            Caribbean             50.4%        51.3%   47.9%   49.7%   52.8%                             62.7%   57.4%
            South America         19.7%        19.9%   21.9%   20.3%   17.3%                                      9.9%
            Asia/Pacific                       10.2%   10.7%   10.0%   11.3%                              9.0%   16.4%
            Indian Ocean/Red Sea   9.7%                 8.8%    8.3%                                     15.3%
            Africa                 8.8%         7.8%    3.2%            6.0%                                       7.8%
                                   4.3%         3.6%    4.4%    2.6%    3.3%                              2.8%
                                   4.2%         4.2%            5.6%    6.0%                                     65.2%
                                                                                                                 15.5%
COSTA       Europe                44.4%        45.4%   45.0%   41.3%   46.0%                             57.5%
            Asia/Pacific          38.4%        36.9%   39.1%   44.0%   39.9%                             22.2%    4.7%
            Indian Ocean/Red Sea                        3.6%                                                      6.4%
            Caribbean              5.6%         3.6%    5.2%    2.2%    2.9%                              3.7%    4.8%
            South America           4.1%        5.3%    3.9%     5.1%   5.5%                               7.6%
                                   3.9%          5.1%            4.1%   2.3%                              5.9%   59.7%
                                                                                                                 17.8%
AIDA        Europe                62.9%        62.1%   64.0%   63.0%   61.4%                             60.2%    9.9%
            Canary Islands        14.8%        15.5%   15.7%   15.9%   16.4%                             16.7%    6.8%
            Indian Ocean/Red Sea   8.2%                 6.0%                                              8.2%
            Caribbean                           6.9%    6.9%     7.3%   7.9%                              8.9%   55.9%
                                    6.1%        7.8%            8.3%    9.0%                                     18.4%
                                                                                                                 18.5%
            Europe                55.4% 58.9% 48.9% 49.1% 52.9% 53.7%
                                                                                                                  5.6%
            Canary Islands        16.7% 14.3% 22.5% 17.6% 13.1% 18.7%
                                                                                                                 69.7%
TUI Caribbean                     12.7% 10.4% 11.8% 11.6% 12.7% 12.5%                                            14.9%
                                                                                                                 11.1%
            Indian Ocean/Red Sea  8.8% 10.4% 10.6% 11.0% 11.6% 11.1%
                                                                                                                 69.7%
            Asia/Pacific          2.9% 3.2% 2.8% 5.7% 7.7% 2.8%                                                  10.3%
                                                                                                                 10.2%
P&O UK      Europe                70.6%        62.2%   69.5%   70.0%   67.7%                             69.6%
            Caribbean             12.2%        16.8%   14.8%   14.3%   14.7%                             13.6%   42.2%
            Canary Islands        11.8%        12.2%   11.7%   11.9%   13.9%                             12.2%   36.4%
                                                                                                                 19.0%
MARELLA     Europe                60.5%        59.1%   60.8%   57.8%   66.3%                             68.9%
            Caribbean             20.5%        23.0%   20.8%   20.0%   20.8%                             19.7%
            Canary Islands                                             10.3%                             10.5%
            Asia/Pacific           9.5%         9.8%    9.5%    9.6%
            Indian Ocean/Red Sea   3.8%         2.9%    1.0%            0.5%
                                   3.0%         2.9%     1.4%   6.7%

            Europe                53.2%        41.8%   38.0%   41.3%   45.5%                             31.8%
                                  22.1%        31.9%   36.3%   39.8%   27.6%                             30.2%
PULLMANTUR  Caribbean             13.0%        10.1%   14.0%   11.3%   23.3%                             36.0%
            South America          0.0%         9.3%
                                                        8.0%    5.4%
            Canary Islands

*Percentage of total passenger capacity deployed in key markets, while the balance is in other markets.

168 Cruise Industry News | 2020 Annual Report