
Page 29 - 2024 CIN Annual Report
P. 29
[ Market Reports ]
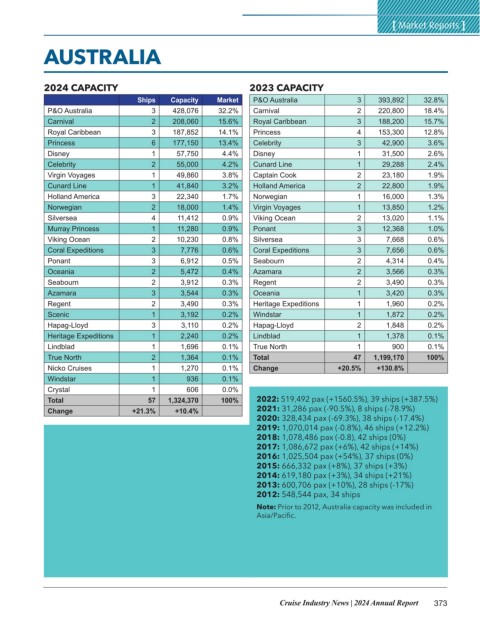
AUSTRALIA
2024 CAPACITY 2023 CAPACITY
Ships Capacity Market P&O Australia 3 393,892 32.8%
P&O Australia 3 428,076 32.2% Carnival 2 220,800 18.4%
Carnival 2 208,060 15.6% Royal Caribbean 3 188,200 15.7%
Royal Caribbean 3 187,852 14.1% Princess 4 153,300 12.8%
Princess 6 177,150 13.4% Celebrity 3 42,900 3.6%
Disney 1 57,750 4.4% Disney 1 31,500 2.6%
Celebrity 2 55,000 4.2% Cunard Line 1 29,288 2.4%
Virgin Voyages 1 49,860 3.8% Captain Cook 2 23,180 1.9%
Cunard Line 1 41,840 3.2% Holland America 2 22,800 1.9%
Holland America 3 22,340 1.7% Norwegian 1 16,000 1.3%
Norwegian 2 18,000 1.4% Virgin Voyages 1 13,850 1.2%
Silversea 4 11,412 0.9% Viking Ocean 2 13,020 1.1%
Murray Princess 1 11,280 0.9% Ponant 3 12,368 1.0%
Viking Ocean 2 10,230 0.8% Silversea 3 7,668 0.6%
Coral Expeditions 3 7,776 0.6% Coral Expeditions 3 7,656 0.6%
Ponant 3 6,912 0.5% Seabourn 2 4,314 0.4%
Oceania 2 5,472 0.4% Azamara 2 3,566 0.3%
Seabourn 2 3,912 0.3% Regent 2 3,490 0.3%
Azamara 3 3,544 0.3% Oceania 1 3,420 0.3%
Regent 2 3,490 0.3% Heritage Expeditions 1 1,960 0.2%
Scenic 1 3,192 0.2% Windstar 1 1,872 0.2%
Hapag-Lloyd 3 3,110 0.2% Hapag-Lloyd 2 1,848 0.2%
Heritage Expeditions 1 2,240 0.2% Lindblad 1 1,378 0.1%
Lindblad 1 1,696 0.1% True North 1 900 0.1%
True North 2 1,364 0.1% Total 47 1,199,170 100%
Nicko Cruises 1 1,270 0.1% Change +20.5% +130.8%
Windstar 1 936 0.1%
Crystal 1 606 0.0%
Total 57 1,324,370 100% 2022: 519,492 pax (+1560.5%), 39 ships (+387.5%)
Change +21.3% +10.4% 2021: 31,286 pax (-90.5%), 8 ships (-78.9%)
2020: 328,434 pax (-69.3%), 38 ships (-17.4%)
2019: 1,070,014 pax (-0.8%), 46 ships (+12.2%)
2018: 1,078,486 pax (-0.8), 42 ships (0%)
2017: 1,086,672 pax (+6%), 42 ships (+14%)
2016: 1,025,504 pax (+54%), 37 ships (0%)
2015: 666,332 pax (+8%), 37 ships (+3%)
2014: 619,180 pax (+3%), 34 ships (+21%)
2013: 600,706 pax (+10%), 28 ships (-17%)
2012: 548,544 pax, 34 ships
Note: Prior to 2012, Australia capacity was included in
Asia/Pacific.
Cruise Industry News | 2024 Annual Report 373